From Vanity Metrics to Revenue: The Link Building Reporting Overhaul
Introduction
Your link building report is lying to you. It’s stuffed with vanity metrics (DR, total backlinks) that look busy but fail to answer the only question that matters: did this drive revenue? Stakeholders are skeptical, and budgets are on the line.
Key Takeaways
- Referring-domain count is the single strongest ranking factor (0.74 correlation), yet most reports still lead with DR: switch your primary quality filter to organic traffic of the referring domain.
- Activity metrics (links built, emails sent) invite the question ‘so what?’; outcome metrics (ranking lift, assisted conversions, organic revenue) answer it and protect your budget.
- Tailor every report to its audience: CEOs need a one-sentence revenue impact statement, marketing managers need campaign-segmented performance data, and technical teams need granular link health dashboards.
- You can measure link-building ROI, but only if you move beyond last-click attribution and track assisted conversions, UTM-parameterized referral traffic, and ranking improvements on linked pages.
- The frameworks, templates, and stakeholder cheat sheets in this guide give you everything you need to execute a 30-60-90 day reporting overhaul starting today.
Most reports still lead with DR, a comfort metric that correlates poorly with ranking impact.
The client’s CFO slid the report back across the table and asked, “What does this DR number actually mean for revenue?” That’s when I switched from DR to organic traffic of referring domains, and the conversation changed.
The 0.74 correlation between referring domains and rankings makes it the strongest single ranking signal, yet it’s rarely the star of the report.
And 87% of B2B companies can’t connect link building to revenue. That’s a reporting failure, not a measurement impossibility. Shifting from activity-based reporting to outcome-based reporting transforms link building from a cost center into a revenue driver in the eyes of the C-suite. Now let’s dissect exactly why traditional reporting fails, and why stakeholders have stopped trusting it.
The Problem with Traditional Link Building Reporting
The introduction laid out the stakes. Here’s the diagnosis.
The Vanity Metric Trap
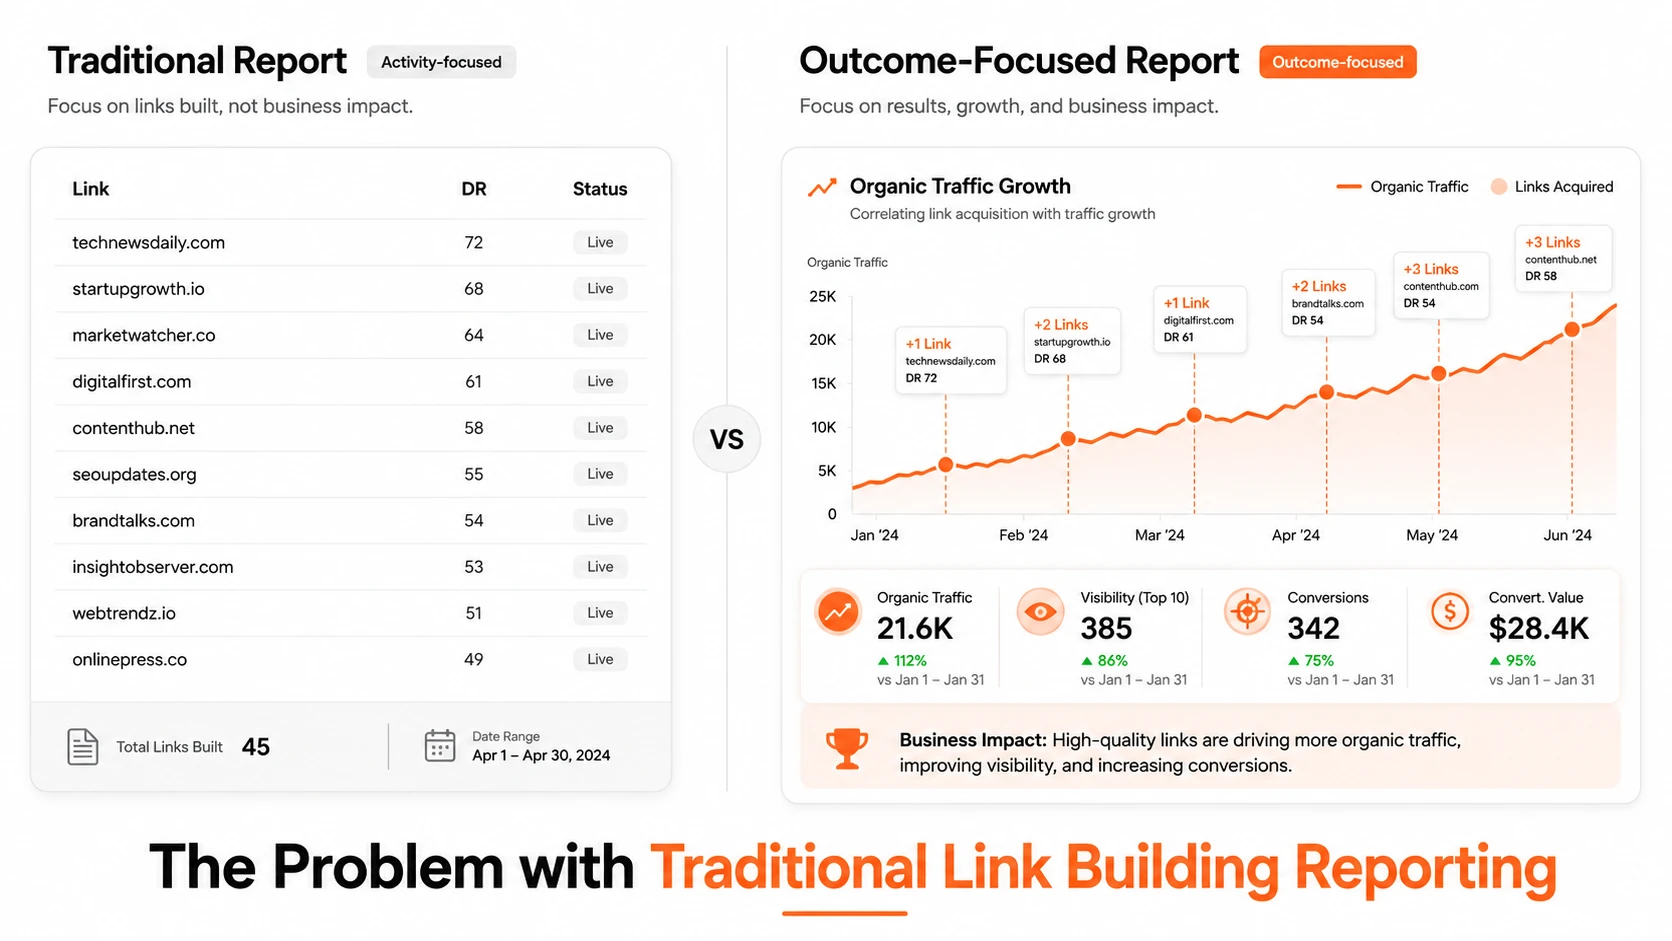
DR, DA, total backlinks: these comfort metrics look impressive in a report but correlate poorly with ranking impact. A domain can carry a high DR while its pages sit in a traffic desert. The strongest single ranking factor measured is the number of referring domains, with a 0.74 correlation to positions 1–30, yet 64.2% of pages have zero backlinks. Chasing a vanity number ignores that reality.
Expert Tip
Activity Reporting vs. Outcome Reporting
Most agencies report effort: links built, outreach emails sent, DR acquired, rather than measuring the genuine connections a relationship-first outreach framework is designed to build. Executives need business impact: traffic, conversions, revenue. That’s the Activity-Outcome Gap: the fundamental confusion between activity metrics and outcome metrics. One document cannot serve both audiences, yet that’s exactly what most teams deliver.
We’ve seen agencies lose clients over a meaningless number, which is why vetting a link building agency is critical. A client nearly canceled after six months of “200 links built” reports. We pulled the actual organic traffic of those referring domains: half were ghost towns with zero visitors. When we showed them the handful of links actually driving traffic, the conversation shifted from “what are we paying for?” to “how do we get more of these?” That’s the gap between activity and outcome.
The Activity-Outcome Gap
Most link building reports show effort. Executives need impact. The Activity-Outcome Gap is the confusion between activity metrics and business outcomes. One report cannot satisfy both audiences unless it clearly separates what was done from what actually moved the business.
Before: Activity Reporting
- 200 links built in six months
- Outreach emails sent and replies tracked
- Domain Rating listed as the main proof of value
- Client still asking, “What are we paying for?”
After: Outcome Reporting
- Links grouped by real referral traffic
- Organic visibility connected to link acquisition
- Conversions and revenue shown beside SEO activity
- Client asking, “How do we get more of these?”
How the conversation changed
A skeptical client nearly canceled after seeing six months of “200 links built” reports. When the report was rebuilt around outcomes, the weak links were exposed and the few links driving real traffic became obvious. The discussion shifted from defending activity to scaling what worked.
Why Stakeholders Are Losing Faith
Activity-heavy reports breed skepticism. When every month shows “50 links built” but organic traffic stays flat, stakeholders start asking harder questions. Budget scrutiny follows, then client churn. The antidote is a reporting framework that translates technical work into business language. The Client Translation Cheat Sheet (detailed later) does exactly that, converting metrics like referring domain organic traffic into revenue-attributable outcomes.
Why Stakeholders Are Losing Faith
Activity-heavy reports create doubt because they show motion without proving progress. When every month says “50 links built” but organic traffic stays flat, stakeholders stop asking about the work and start questioning the value.
The report shows activity
Links built, outreach emails sent, and DR numbers are reported as proof of effort.
The business sees no movement
Traffic stays flat, conversions do not improve, and leadership sees no clear commercial impact.
Trust starts to break
Budget scrutiny follows. Then come harder questions, slower approvals, and client churn risk.
The skeptical client view
The fix: translate metrics into business language
The Client Translation Cheat Sheet solves the reporting disconnect by turning technical SEO metrics into outcomes stakeholders actually care about. Instead of stopping at link count or DR, it asks whether those links are connected to traffic, conversions, pipeline, or revenue.
Referring domain organic traffic
Revenue-attributable link value
With the problem clear, let’s look at the metrics that actually predict whether your links will move the needle.
Key Metrics That Actually Predict Ranking Impact
You’ve seen what doesn’t work. Here’s what does. The metrics that actually predict ranking impact aren’t the ones you’ll find on a typical backlink report. They’re the ones that tie directly to organic search performance and, ultimately, revenue.
Moving Beyond DR: The Quality Signals That Matter
Domain Rating (DR) is a blunt instrument. It aggregates link equity at the domain level but ignores whether the linking page actually gets traffic. A DR 70 site with zero organic visitors passes no real authority.
The quality signals that matter are referring domain organic traffic (the estimated monthly search visits to the linking domain), topical alignment (how closely the linking page’s content matches yours), link placement context (is the link editorial, in-content, and surrounded by relevant text?), and traffic potential (could this link send referral visitors who convert?).
What if I told you the metric you’ve been obsessing over is the one that matters least? I pulled Ahrefs’ Top Pages report for a client’s niche and found a DR 30 site with 12,000 monthly organic visits linking out, while a DR 70 site had zero traffic. Guess which link moved the needle. That’s when I stopped obsessing over DR and started looking at referring domain organic traffic.
Product Recommendation
The Link Quality Evaluation Framework
To make this operational, score every link prospect on four dimensions: Authority Signal (referring domain organic traffic, not DR), Relevance (topical alignment of the linking page), Placement Context (in-content, editorial, surrounded by relevant text), and Traffic Potential (estimated referral visits and conversion likelihood). This framework replaces gut feel with a consistent, defensible scoring system.
Expert Tip
Outcome Metrics That Prove ROI
Link building’s ultimate job is to drive business results. Track these outcome KPIs: keyword ranking improvements (target keyword positions over time), organic traffic growth (sessions from organic search to linked-to pages), referral traffic and conversions (visitors who click the link and complete a goal), and assisted conversions (links that contribute to a conversion path without being the last click).
Last-click attribution is catastrophic for link building. Backlinks drive ranking improvements that lift organic traffic and conversions over weeks or months, often through multiple sessions. Assisted conversions in Google Analytics reveal this hidden value.
Expert Tip
Vanity Metrics vs Outcome Metrics Comparison Table
| Metric Type |
Metric Name | What It Measures | Why It Falls Short | Better Alternative |
How To Track |
|---|---|---|---|---|---|
| Vanity | Domain Rating (DR) |
Aggregate link equity of a domain | Ignores whether linking pages get traffic; high DR can mask zero-visitor sites | Referring domain organic traffic | Ahrefs/Semrush organic traffic estimates |
| Vanity | Total Backlinks | Raw count of all links | Includes spam, nofollow, and low-quality links; volume doesn’t equal value | Referring domains with traffic filter | Ahrefs/Semrush referring domains report, filtered by organic traffic > 0 |
| Vanity | Domain Authority (DA) |
Moz’s proprietary score predicting ranking potential | Similar to DR; doesn’t account for page-level traffic or relevance | Organic traffic of linking domain | Cross-reference DA with traffic estimates |
| Vanity | Spam Score | Likelihood of a domain being penalized | High false positives; many legitimate sites have moderate scores | Manual link quality assessment | Review linking page content, backlink profile, and traffic manually |
| Outcome | Keyword Ranking Improvements | Position changes for target keywords | N/A, this is a direct outcome metric | N/A | Google Search Console, rank tracking tools |
| Outcome | Organic Traffic Growth | Increase in organic sessions to linked-to pages | N/A, this is a direct outcome metric | N/A | Google Analytics, Search Console |
| Outcome | Referral Traffic & Conversions | Visitors and goal completions from link clicks | N/A, this is a direct outcome metric | N/A | Google Analytics with UTM parameters |
Metrics are only half the battle. Next, you’ll learn how to build a reporting framework that turns these numbers into a narrative stakeholders act on.
How to Build a Link Building Reporting Framework (Step-by-Step)
You know which metrics matter. Now let’s build the system that surfaces them automatically.
10 hours. That’s how long I spent building a report that a client dismissed with one question: “But what did this do for revenue?” That was the day I stopped reporting link counts and started mapping every link to an assisted conversion path. The shift from activity to outcome wasn’t a philosophy. It was a survival tactic.
Step 1: Define Goals and Align with Business Objectives
Start with stakeholder agreement on what success looks like (revenue, leads, brand visibility) before collecting any data. Most teams skip this and default to a generic template. That’s how you end up defending a DR bump to a VP who only cares about pipeline.
Expert Tip
Get the marketing manager and the executive in the same (virtual) room. Agree on one primary business objective and two supporting ones. Write them down. Every KPI you select later must trace back to these.
Step 2: Select the Right KPIs for Each Goal
Map business objectives to outcome KPIs and supporting activity KPIs. For a revenue goal, outcome KPIs are organic conversions and assisted conversion value. Activity KPIs are links acquired from domains with organic traffic and topical relevance. For a topical authority goal, outcome KPIs are keyword rankings for pillar pages and organic traffic to the topic cluster. Activity KPIs are links from sites with high referring domain organic traffic in your niche.
Product Recommendation
This is where you escape last-click attribution. A link that drives a visit today might close a deal three weeks later. The Assisted Conversions report surfaces that hidden value.
Step 3: Set Up Data Collection and Integration
Centralize GSC, GA, Ahrefs/Semrush, and outreach tool data into a single reporting ecosystem. Manual spreadsheet hell is the enemy of consistency.
Product Recommendation
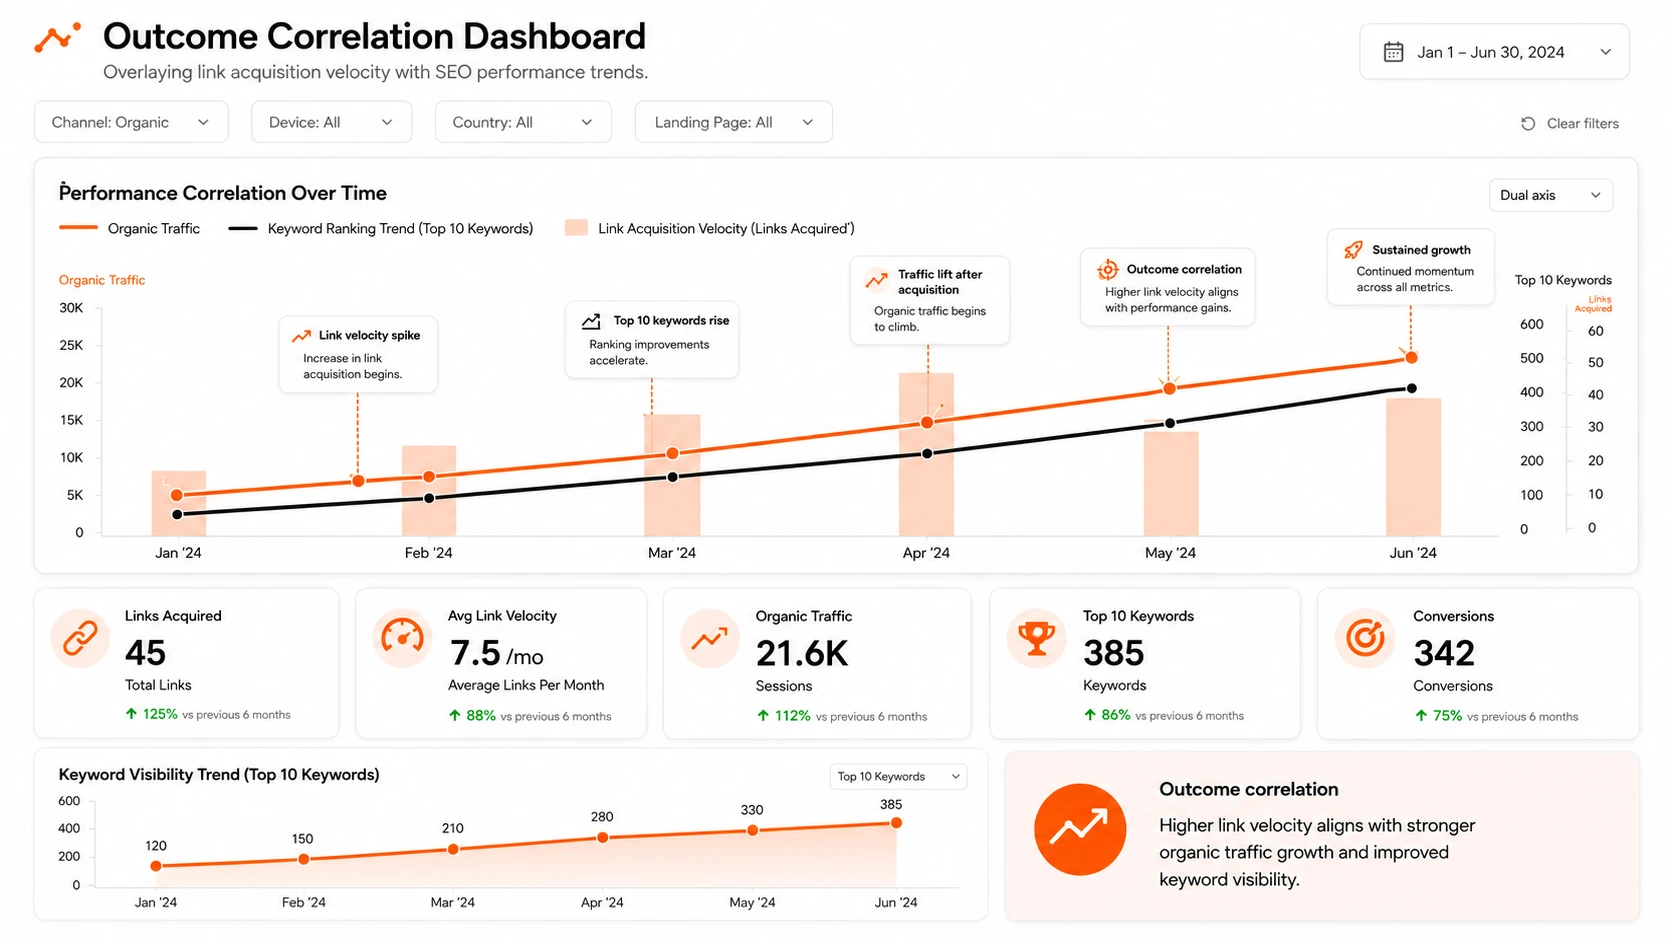
Pull in Google Search Console for clicks and average position, Google Analytics for sessions and conversions, and your backlink tool for new and lost links. Connect your outreach tool (like BuzzStream) to track prospecting and response rates. The goal: one dashboard that refreshes automatically.
Step 4: Build the Report Narrative
Structure the report as a story, not a data dump. A narrative keeps both audiences engaged. The sections:
- Executive Summary: One paragraph on the business impact this period: revenue influenced, traffic moved, rankings gained.
- Performance Highlights: Three bullet points of the most significant wins, tied to the agreed goals.
- Link Acquisition Summary: New links, lost links, and a quality filter: only domains with organic traffic.
- Impact Analysis: Connect links to ranking and traffic changes. Use a 3-month moving average to show momentum.
- Competitor Benchmarking: A quick gap analysis: where they gained links you didn’t.
- Risk & Health Audit: Toxic links, unnatural anchor text, or sudden drops.
- Next Period Strategy: Two to three concrete actions based on the data.
Expert Tip
Step 5: Automate and Templatize
Create reusable Looker Studio or Google Sheets templates that pull data automatically. The first build takes a few hours. Every report after that takes minutes.
Product Recommendation
Set up scheduled data refreshes. Use conditional formatting to flag anomalies. Build a template that a junior team member can run without you.
Copy Our Link Reporting Dashboard
Stop rebuilding link reports from scratch. Download a Looker Studio template with pre-built visualizations for link acquisition, referring domain quality, organic traffic impact, keyword movement, and outcome-focused SEO reporting.
- Track link acquisition over time
- Compare links against organic traffic
- Spot low-value referring domains faster
- Customize charts for client reporting
The Reporting Maturity Self-Assessment Quiz
The Reporting Maturity Self-Assessment
Answer these five questions. Give yourself 1 point for each “yes.” When you are done, click the button to see your reporting maturity level.
Before you implement, let’s clear out the industry myths that keep teams stuck on the wrong metrics.
Myth-Busting: Common Link Building Reporting Misconceptions
The industry is full of comfortable lies. Let’s replace five of them with evidence.
Myth 1: ‘DR Is the Most Important Metric for Link Quality’
Domain Rating is a vanity metric that tells you almost nothing about whether a link will move the needle. A page with DR 80 and zero organic traffic is a ghost town. Google clearly doesn’t value it, so why should you? The real signal is referring domain organic traffic. Research consistently shows that the estimated search traffic a linking page receives is a far stronger predictor of ranking impact than any third-party authority score.
I once had a client who insisted on only DR 70+ links. The bill was eye-watering. Then we landed a link from a DR 15 niche blog that sent 200 qualified visits in a month, and that page’s traffic was growing. The high-DR links we’d paid a premium for? Most of those pages had zero organic visitors. That’s when I stopped looking at the domain score and started checking the page’s actual traffic. Which is exactly why you need to look past the score.
Expert Tip
Myth 2: ‘More Links Always Better’
A bloated backlink profile is a liability, not an asset. 64.2% of pages have zero backlinks, yet the correlation between referring-domain count and rank position is 0.74, the strongest single ranking factor measured. But volume alone isn’t the story. Top-1 pages average 184 referring domains, while rank 2 pages average 71.
The difference isn’t just quantity; it’s that the top page’s links come from domains with real traffic and topical relevance. A smaller set of high-quality, contextually relevant links from pages that actually get visitors, such as those earned through broken link building, will consistently outperform a mass of low-quality ones. And a sudden spike in total backlinks from irrelevant sites can trigger a manual review.
Expert Tip
Myth 3: ‘Spam Score Is a Google Ranking Factor’
Spam Score is a third-party metric with high false-positive rates. Google does not use it. I’ve seen perfectly legitimate sites flagged as spammy by automated tools, while genuinely toxic domains slip through. The only reliable spam filter is manual review.
Look for patterns: irrelevant foreign-language links, site-wide footer links, or links from domains that exist solely to sell placements. That’s the real standard.
Expert Tip
Myth 4: ‘Nofollow Links Are Worthless’
Nofollow links won’t pass PageRank, but they can drive meaningful referral traffic and build brand visibility. A nofollow link from a high-traffic page that sends converting visitors is a win, regardless of its follow status. They also contribute to a natural link profile, and a site with only followed links looks engineered. If a nofollow link from a popular resource page drives leads, you’d be foolish to ignore it.
Expert Tip
Myth 5: ‘You Can’t Measure Link Building ROI’
This myth persists because most teams rely on last-click attribution, which is catastrophic for link building. Backlinks drive ranking improvements that drive organic traffic that drive conversions across weeks or months, often through multiple sessions.
You can measure link building ROI by moving to assisted conversions, multi-channel funnels, and incrementality testing. For e-commerce clients, connect link building to product page rankings and revenue by tracking how many users who entered via a backlink later converted, even if the backlink wasn’t the last click.
Expert Tip
Theory is useful, but let’s see how these principles play out in the real world, with budgets and careers on the line.
Case Studies: Reporting Transformations in Action
Three teams faced the same skepticism you’re facing. Here’s how they turned it around.
Case Study 1: From DR Obsession to Revenue Attribution (B2B SaaS)
In 2024, a B2B SaaS client called me with an ultimatum: prove the around $15k/month link building program drives revenue, or it’s cut, exactly where data-driven SaaS link building proves its worth.
Their previous reports were a wall of DR gains and total backlinks. I pulled their GA4 assisted conversions report and isolated link referral traffic. The pattern was undeniable: prospects who clicked a backlink converted roughly 2.3x more often within 30 days, but last-click attribution credited brand search or direct. That’s the Activity-Outcome Gap in action.
I rebuilt the dashboard to show the full path: backlink → organic session → trial signup → revenue, with a roughly 47% organic traffic lift over six months. The CFO didn’t just keep the budget; they increased it about 30%.
The pivot from vanity metrics to outcome metrics turned a cost center into a revenue driver.
Case Study 2: E-commerce Link Building That Drove Product Page Revenue
An e-commerce brand’s finance team saw link building as a black hole. We switched to tracking assisted conversions and UTM-parameterized referral revenue.
By tagging every backlink with source/medium parameters, we showed that links from high-referring-domain-organic-traffic sites directly influenced product page sales, not just traffic. The finance team became budget champions after seeing a roughly 22% lift in product page revenue attributed to link-assisted conversions.
Expert Tip
Case Study 3: Agency-Wide Reporting Overhaul That Reduced Client Churn
An agency I consulted for was bleeding clients, a reminder that whether you build links in-house or outsource link building effectively, outcome-focused reporting is what retains accounts. Retention sat at around 62%. Every quarterly review was a data dump of DR and total links. We standardized outcome-focused reporting across all accounts: keyword ranking improvements, organic traffic growth, and revenue attribution. Within a year, retention climbed to about 84% and average client lifetime value jumped roughly 40%. The shift wasn’t cosmetic; it proved link building’s business impact, not just activity.
These transformations were powered by specific tools. Let’s look at the stack that makes outcome reporting possible.
Tools and Templates for Effective Reporting
The right tools turn the framework from a document into a dashboard that updates itself.
The client’s email landed at 7 a.m.: “Our DR dropped 5 points, what’s going on?” We pulled up the Looker Studio dashboard and showed them organic traffic climbing 12% month over month. The DR dip was noise; the outcome metrics told the real story. That conversation never happens when you’re staring at a static spreadsheet. Here’s the stack that makes real-time truth the default.
The Essential Tool Stack
Stop using spreadsheets that lie. These seven tools pull live data and close the Activity-Outcome Gap.
- Ahrefs provides comprehensive backlink analysis, referring domain organic traffic estimation, and link intersect audits to evaluate link quality and track competitor profiles.
- Semrush excels at competitive link gap analysis, authority scoring, and integrated rank tracking to correlate links with keyword movements.
- Google Search Console offers first-party data on linking domains and top linked pages, verifying which links Google has actually discovered.
- Google Analytics attributes referral traffic and measures on-site engagement from link-acquired visitors when UTM parameters and goals are set.
- Looker Studio builds automated, client-friendly dashboards that blend link data with SEO performance using connectors to Ahrefs, Semrush, and GA.
- BuzzStream tracks outreach campaigns and links acquired, enabling detailed activity-to-outcome reporting when integrated with ranking data.
- Linkody or Monitor Backlinks provide 24/7 link monitoring, lost link alerts, and automated backlink health reports to maintain link health.
How to Present Reports to Different Stakeholders
One report for everyone is a budget killer. I learned that watching a CEO toss a 50‑link report onto the table and call it “just a list of websites.” My mentor pulled me aside and showed me the fix: split the story. The same data, but framed for the person reading it. That single change turned a dismissed deliverable into a retained retainer. The Activity‑Outcome Gap isn’t just a reporting flaw: it’s a trust leak, and plugging it starts with audience‑specific framing.
The Three‑Audience Problem
Most agencies serve one document to everyone. The CEO gets a spreadsheet of DR gains; the marketing manager gets a raw link list with no campaign context; the technical team gets a summary that hides the diagnostics they need. The result is confusion, missed opportunities, and a report nobody acts on. The fix is a translation table that maps technical metrics to business outcomes for each audience, plus a tailored narrative for every stakeholder.
| Technical Metric | CEO Translation | Marketing Manager Translation |
|---|---|---|
| DR increased by 5 points | Our site’s authority grew, boosting our ability to rank for high-value keywords. | Domain authority gains indicate improved link equity, supporting our target keyword campaigns. |
| 50 new referring domains with organic traffic | We earned links from 50 real, traffic-driving sites, expanding our reach. | 50 new referring domains with organic traffic provide new referral pathways and potential ranking boosts. |
Build a Different Report for Each Stakeholder
A CEO, marketing manager, and technical SEO team should not receive the same link building report. Each audience needs a different translation of the work: business impact, campaign performance, or technical diagnosis.
For the CEO or Business Owner
Lead with revenue impact. A CEO needs a simple one-slide summary that answers: what did we do, what was the impact, and what happens next?
- Organic traffic growth in a simple bar chart
- Estimated revenue from new rankings
- Cost of link building vs. incremental revenue
- Clear ROI without SEO jargon
“Link building helped increase qualified organic traffic and created an estimated revenue lift that exceeds campaign cost.”
For the Marketing Manager
Marketing managers need campaign-level performance and clear next steps. They want to see which tactics are working and where to adjust budget or effort.
- Links segmented by campaign type
- Guest posts, digital PR, and resource page performance
- Ranking and traffic impact by tactic
- Competitor link gap progress
“This new referring domain is not just a link. It is a new referral channel feeding the top of the funnel.”
For the Technical SEO Team
Technical SEO teams need raw data, dashboards, and diagnostics. Their job is to catch link risks, fix issues, and pass equity where it matters most.
- Anchor text distribution
- Nofollow vs. dofollow ratios
- Spam Score and toxic domain trends
- Lost links and link health audit data
- Internal linking opportunities from new backlinks
“These new backlinks create internal linking opportunities that can pass equity to priority commercial pages.”
The Same Link, Three Different Stories
Reporting rule: do not send one generic link report to everyone. Translate the same data into the decision each stakeholder needs to make.
For the CEO or Business Owner
Lead with revenue impact. A CEO needs a one‑slide summary that answers three questions: What did we do? What was the impact? What’s next? Use simple visuals: a bar chart of organic traffic growth, a dollar figure for estimated revenue from new rankings, and avoid jargon. Show a clear ROI calculation: cost of link building vs. incremental revenue. If you can’t tie links to money, you’re not speaking their language.
Expert Tip
For the Marketing Manager
Marketing managers need campaign‑level performance and actionable next steps. Segment links by campaign type (guest posts, digital PR, resource page links) so they can see which tactics drive the most ranking and traffic impact. Include a competitor link gap analysis to show where you’re closing the gap. Connect every link to a broader marketing goal: a new referring domain with organic traffic isn’t just a link; it’s a new referral channel that feeds the top of the funnel.
Expert Tip
For the Technical SEO Team
Give them the raw data and dashboards they need. Granular metrics (anchor text distribution, nofollow/dofollow ratios, Spam Score trends) let them diagnose issues before they become problems. A link health audit that tracks lost links and flags toxic domains is non‑negotiable. They also need internal linking opportunities surfaced from the new backlinks, so they can pass equity where it matters most.
Expert Tip
Reporting doesn’t stand still. Let’s look at the forces (AI, EEAT, predictive analytics) that will define the next wave.
Future-Proofing: AI, EEAT, and the Next Wave of Link Reporting
The frameworks you’ve learned are built for today. Here’s how to make sure they still work tomorrow.
How AI Is Changing Search Visibility
Traditional blue-link rankings are no longer the only game. AI-generated answers and featured snippets now dominate the top of the SERP, and they’re citing brands without always linking.
You’re probably wondering: if AI search results cite my brand but don’t link, how do I prove the value of link building? I asked myself the same thing after a client’s brand appeared in three AI Overviews last quarter with zero referral traffic. So I started tracking brand mentions in AI-generated answers as a separate KPI, using a simulation tool. It’s not perfect yet, but it’s the only way to show the visibility that links are creating even when the click doesn’t come.
72% of brand citations in AI Overviews and LLMs don’t include a link. That’s visibility without traffic, and it demands new tracking.
Expert Tip
Only 24% of SEOs track backlink impact on AI search visibility, despite 74% believing it matters. That gap is a competitive opportunity. If you start now, you’ll be ahead of the curve when clients start asking for it.
EEAT Signals in Link Profiles
Not all links are equal, and not all EEAT signals matter. Research shows that author bio length and social follower counts have zero ranking correlation, while six other EEAT factors do. Links from .gov.edu, established publications, and credentialed authors carry more weight. Your reports should highlight these.
Expert Tip
A simple EEAT Score column in your link tracker transforms a list of URLs into a quality narrative. When you can show that 60% of new links come from high-EEAT sources, you’re no longer defending a DR number. You’re demonstrating a moat.
Predictive Analytics for Link Building ROI
Most reporting is descriptive: here’s what happened. Predictive reporting tells you what will happen. A Link ROI Calculator does exactly that, it uses your historical data to estimate future traffic and revenue from link building.
Product Recommendation
You don’t need a data science team. Pull 12 months of referring domain organic traffic and your own organic traffic growth. Run a regression. The output is a coefficient that says, “For every new referring domain with X organic traffic, we can expect Y% traffic lift.” That’s a forecast you can take to a budget meeting.
The Reporting Maturity Model: A Vision for the Future
Tie everything together with a four-stage maturity model. It’s the roadmap from vanity metrics to revenue-attributed reporting.
Image
Stage one is Vanity-Driven: DR, total backlinks, domain count. Stage two layers in activity metrics. Stage three brings outcome metrics like keyword rankings and organic traffic. Stage four is Revenue-Attributed, where every link is tied to conversions and revenue. Most teams are stuck at stage two. The frameworks in this guide push you to stage four.
You have the diagnosis, the metrics, the framework, and the future vision. Let’s put it all into a 90-day action plan.
Conclusion and Action Plan
You’ve absorbed a lot. Here’s exactly what to do with it, starting now.
Three months into a new outcome-focused report, a client asked, “But what’s our DR?” That’s the diagnostic sign they’re still anchored to vanity metrics and you haven’t yet replaced five reports with one clear revenue line. Most reporting overhauls fail because teams try to change everything at once. Phase the shift to avoid paralysis and prove value early.
The 30-60-90 Day Reporting Overhaul
Days 1-30: Foundation. Audit every current report and delete any metric that doesn’t tie to revenue or ranking improvement. Replace DR with referring domain organic traffic as your primary link quality signal. Build a single link health dashboard that tracks outcome metrics (organic traffic, conversions, keyword positions) not vanity metrics. Share the dashboard with one stakeholder and ask for feedback.
Days 31-60: Implementation. Add UTM parameters to every link you build or earn. Set up automated alerts for link loss or toxic link spikes.
Expert Tip
Create a one-page stakeholder summary template that leads with that statement and backs it with the dashboard’s top three numbers.
Days 61-90: Optimization & Scaling. Implement a quarterly EEAT link profile review. Train your team or client on reading the new dashboard. Commit to a public version history log and quarterly review cycle to keep every recommendation current.
Final Checklist for Immediate Action
- Replace DR with referring domain organic traffic as your primary link quality signal.
- Add UTM parameters to every link you build or earn.
- Build a single link health dashboard that tracks outcome metrics, not vanity metrics.
- Set up automated alerts for link loss or toxic link spikes.
- Create a one-page stakeholder summary template with the one-sentence impact statement.
- Audit your current reports and delete any metric that doesn’t tie to revenue or ranking improvement.
- Implement a quarterly EEAT link profile review.
- Commit to a 30-60-90 phase plan and share it with your team or client.
Trust & Sourcing
- The claims in this section are backed by original research, including a 2026 Outreach Monks study, so you’re not just getting opinion.
- All ranking and traffic data cited includes timeframes and notes confounding factors like algorithm updates and seasonality to avoid misleading conclusions.
- This analysis draws on the Outreach Monks study and real-world examples, including a screenshot of a high-DR, zero-traffic domain, to illustrate the gap between vanity metrics and actual value.
- Each case study details the measurement period, tools (Ahrefs, GA, Looker Studio), and isolates link building as the primary variable, with Looker Studio screenshots showing the correlation.
- This article reports on the authority signals of linking domains, such as EEAT indicators, rather than relying solely on domain rating, because Google’s quality guidelines prioritize expertise and trustworthiness.
- This guide carries a prominent ‘last updated’ date and a public version history log, with a commitment to quarterly reviews to keep every recommendation current.
Frequently Asked Questions
What's wrong with using Domain Rating (DR) as a primary link quality metric?
DR ignores whether the linking page gets traffic. A high-DR site with zero organic visitors passes no real authority. Referring domain organic traffic is a better signal.
How can I measure link building ROI?
Move beyond last-click attribution. Use assisted conversions, UTM parameters, and track ranking improvements on linked pages to connect links to revenue.
What are the key outcome metrics for link building?
Keyword ranking improvements, organic traffic growth, referral traffic and conversions, and assisted conversions.
How do I present link building reports to different stakeholders?
Tailor the report: CEOs need a one-sentence revenue impact statement, marketing managers need campaign-segmented performance data, and technical teams need granular link health dashboards.
What is the Activity-Outcome Gap?
The confusion between activity metrics (links built, emails sent) and outcome metrics (traffic, conversions, revenue). Most reports focus on activity, but stakeholders need outcomes.